Thyroid Detection using Machine Learning
FREE Online Courses: Click for Success, Learn for Free - Start Now!
With this Machine Learning Project, we will develop hypo thyroid disease detection model. For this project, we will be using two models which are KNN and Decision Tree.
So, let’s build this system.
Hypo Thyroid Disease
Incidences of thyroid illness have increased recently. One of the most crucial roles in controlling metabolism belongs to the thyroid gland. Two of the most prevalent disorders caused by thyroid gland irregularities are hyperthyroidism and hypothyroidism. Each year, a substantial number of patients are identified as having thyroid conditions such as hypothyroidism and hyperthyroidism. Levothyroxine (T4) and triiodothyronine (T3) are produced by the thyroid gland, and both hypothyroidism and hyperthyroidism can result from a lack of thyroid hormones.
In the literature, a variety of methods are suggested for diagnosing thyroid illness. In order to appropriately treat the patient at the appropriate time, save lives, and reduce medical costs, a proactive thyroid disease diagnosis is important.
Machine learning and deep learning techniques are used to forecast thyroid diagnosis in the early stages and identify the different types of thyroid disease, such as hypothyroidism and hyperthyroidism. This is possible because of technological breakthroughs in data processing and computation. Technologies like data mining, big data, image and video processing, and parallel computing have gotten advanced, and this has benefited the healthcare industry.
Applications for data mining in health care include early disease detection and diagnosis, virus outbreak forecasting, drug development, and testing, health care data management, patient-specific medication recommendations, etc. Healthcare experts work to recognize diseases in their earliest stages so that patients can receive the correct care and the condition can be cured quickly and cheaply. One of the illnesses that affect a major portion of people worldwide is thyroid disease.
The American Thyroid Association, the foremost professional organization in the world, estimates that 20 million Americans suffer from a thyroid condition. One in twelve Americans may receive a thyroid problem diagnosis at some point in their lives. According to these figures, thyroid-related illness should not be taken lightly. It would be ideal to use cutting-edge technologies to improve medical procedures for identifying and treating thyroid disorders.
Choosing Model
Machine Learning has offered a number of methods for classifying and detecting thyroid illness. For instance, Garcia utilized the machine learning methods RF, LR, GBM, SVM, and deep neural networks to forecast the highly likely molecules which are the starting of the thyroid hormone balance (DNN). For additional testing in the early stages of thyroid illness, the molecules’ early prediction is useful. For the purpose of conducting the research, the molecular events were gathered from ToxCast databases. According to research, thyroid peroxidase (TPO) and thyroid hormone receptor (TR), with F1 scores of 0.83 and 0.81, respectively, had the best predictive performance. The researchers used feature selection methods and image processing techniques.
Another key issue in the health sector is how to classify thyroid conditions. In order to categorize thyroid disease into categories of normal, hypothyroidism, or hyperthyroidism. Razia(a researcher) compared the performance of various machine learning algorithms.
The datasets were obtained by the researcher from the machine learning collection at the University of California, Irvine (UCI). There are 7200 samples total in the collection, and each sample has 21 properties. DT performed 99.23% better than the SVM, NB, and multilinear regression (MLR). To evaluate the applicability of the results for real-time datasets, however, the multi-classification is restricted to three categories, and only scant information on data pretreatment is given.
The research suggests a multi-kernel SVM to categorize thyroid disorders. According to the researchers, the multi-kernel SVM achieved a performance accuracy of 97.49%. The improved gray wolf optimization performs the feature selection and enhances the performance.
Decision Tree
Decision Tree is going to be a really great choice for this project. When the response variable is categorical, a decision tree is utilized. Decision trees are based on tree-like structures that describe the categorization process based on input features. The Decision Tree can take any type of input variable like discrete, continuous, and even a graph. The steps for implementing the Decision Tree are:
Algorithm
- Create a tree using the input features of the nodes.
- Choose a feature to forecast the result from the input feature with the best information gain.
- Each attribute in each tree node is calculated to determine which node has the biggest information gain.
- Repeat step 2 to create a subtree by using the feature which is not used in the above nodes.
KNN
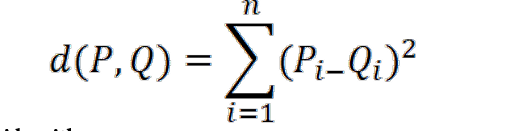
KNN is another supervised learning algorithm. KNN aids in the resolution of classification and regression issues. KNN is a sluggish prediction method. It works on the idea that related things are located close to one another. Similar data points are frequently found close together. It assists in categorizing fresh work using similarity metrics. The KNN algorithm collects all the records and categorizes them based on how similar they are. A structure resembling a tree is used to calculate the distance between the spots. The algorithm locates the nearest data points in the training data set, or the new data point’s nearest neighbors, to create a forecast. Here, K is always a positive integer and stands for “number of close neighbors”. The value of the neighbor is picked from a range of classes. Most definitions of proximity use the Euclidean concept of distance. The following equation describes the Euclidean distance between two points P and Q, i.e., P (p1, p2,…. Pn) and Q (q1, q2,…. Qn):
Project Prerequisites
The requirement for this project is Python 3.6 installed on your computer. I have used a Jupyter notebook for this project. You can use whatever you want.
The required modules for this project are –
- Numpy(1.22.4) – pip install numpy
- Pandas(1.5.0) – pip install pandas
- Seaborn(0.9.0) – pip install seaborn
- SkLearn(1.1.1) – pip install sklearn
That’s all we need for our project.
Thyroid Detection Project & DataSet
We provide the source code as well as dataset that will be required in thyroid detection project. We will require a csv file for this project. You can download the dataset and the jupyter notebook from the link below.
Download the dataset and the jupyter notebook from the following link: Thyroid Detection Project
Steps to Implement
1. Import the modules and the libraries. For this project, we are importing the libraries numpy, pandas, sklearn, seaborn, and matplotlib.
import pandas as pd#import the pandas module becuase our dataset is a csv file
import numpy as np #import the numpy module becuase our dataset is a csv file
import matplotlib.pyplot as plt#import the matplot library to plot the heatmap to see the correlation
import seaborn as sns#import the seaborn library to plot the heatmap to see the correlation
2. Here we are reading our dataset. And we are printing our dataset.
path = open("thyroid.csv")#here we are defining the path of our dataset file
dataframe = pd.read_csv(path)#here we are using the read_csv function to read the csv file from the path

dataframe #here we are rpinting the dataframe
3. Here we are dropping the unused column.
dataframe.drop("other",axis=1,inplace=True) #here we are dropping the 'other column' of the dataset as it is not much used
4. Here we are assigning the column names and storing them in an array.
fcols = ["age",
                "sex",
                "on_thyroxine",
                "query_on_thyroxine",
                "on_antithyroid_medication",
                "sick",
                "pregnant",
                "thyroid_surgery",
                "I131_treatment",
                "query_hypothyroid",
                "query_hyperthyroid",
                "lithium",
                "goitre",
                "tumor",
                "hypopituitary",
                "psych",
                "TSH measured",
                "TSH",
                "T3_measured",
                "T3",
                "TT4_measured",
                "TT4",
                "T4U_measured",
                "T4U",
                "FTI_measured",
                "FTI",
                "TBG_measured",
                "TBG",
               "target"]
5. Here we are assigning the names to columns.
dataframe.columns = fcols #here we are changing the name of the columns in the dataset
dataframe  #printing the dataset first 5 rows again to see the dataset
target = df.target #here we are storing our target into a target variable
create = target.str.split('([A-Za-z]+)', expand=True) #here we are trying to split the target into create
create = create[1] #here we took the 1st data of the create becuase it is in a string format
target = create.replace({None:'Z'}) #Z is no a type of thyroid disease
df.target = target #storing the target into our target dataset column again
6. Here we are dropping the unnecessary columns. and we are filling the null values with the mean of the columns.
dataframe = df.replace(['?'],np.nan) #here we are replacing the ? values with the null so that we can do some processing
dataframe.drop(['TSH measured','T3_measured'],axis=1,inplace=True) #these looks like some unnecessary columns so we are dropping them becuase they are not going to be used iin our processing
dataframe.drop(['TT4_measured','T4U_measured '],axis=1,inplace=True) #these looks like some unnecessary columns so we are dropping them becuase they are not going to be used iin our processing
dataframe.drop(['FTI_measured','TBG_measured '],axis=1,inplace=True) #these looks like some unnecessary columns so we are dropping them becuase they are not going to be used iin our processing
dataframe.sex.replace({'F':2,'M':1},inplace=True) #here we are labeling our male as 1 and female as 2
meanval = round(dataframe.sex.mean()) #here we are stroign the mean of sex column
df.drop('TT4',axis=1,inplace=True)#this column has the highes correlation so we are dropping it
dataframe.sex.fillna(meanval,inplace=True) #here we are filling the null values of sex column with the mean
7. Here we are checking the null values.
dataframe.isnull().sum() #checking if any null value is present
8. Here we are filling the null values using KNNInputer.
from sklearn.impute import KNNImputer #importing the KNNInputer function from the sklearn.impute to fill the null values
knnimp = KNNImputer(n_neighbors=3) #making an instance of the KNN Inputer with neighbors=3

cols = ['TSH','T3','TT4','T4U','FTI'] #strogin the empty columns into the cols variables
for i in cols:
    dataframe[i] = knnimp.fit_transform(dataframe[[i]]) #here we are using the fit_transform function to fit the dataframe and filling the null values of it
9. Here we are checking if there is still any null values present.
dataframe.isnull().sum() # now we can see there is no null values
10. Here we are dropping the ‘target’ column and we are storing it in the y column.
df2 = df.drop('target',axis=1) #making our x dataset by dropping our target column
y = df.target #storing our target column into y column

df2
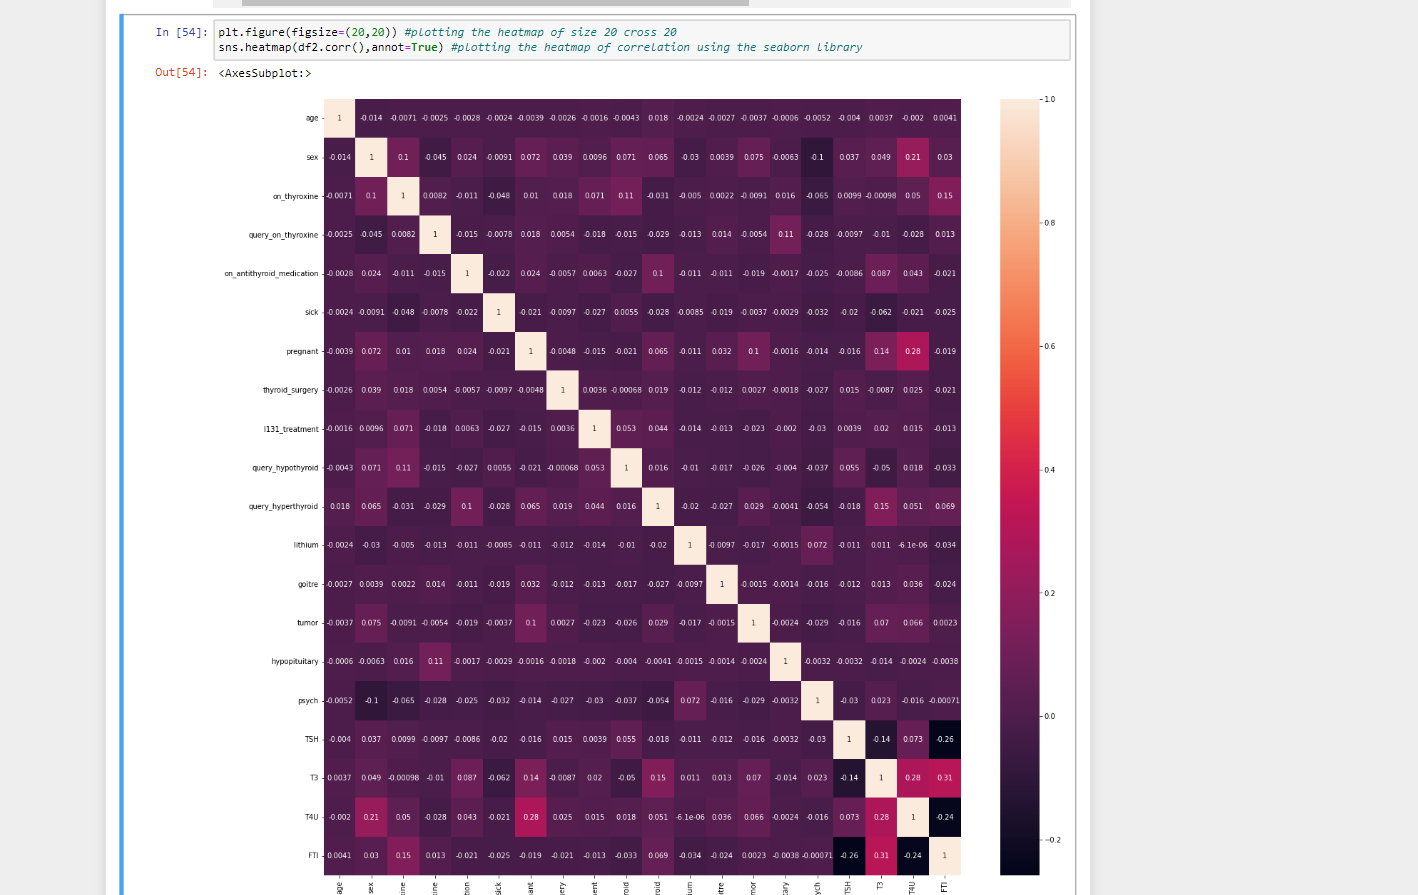
11. Here we are plotting a heatmap of size 20, 20. We are taking a correlation of the dataframe and then we are plotting the heatmap of the correlation using the seaborn library.
plt.figure(figsize=(20,20)) #plotting the heatmap of size 20 cross 20
sns.heatmap(df2.corr(),annot=True) #plotting the heatmap of correlation using the seaborn library
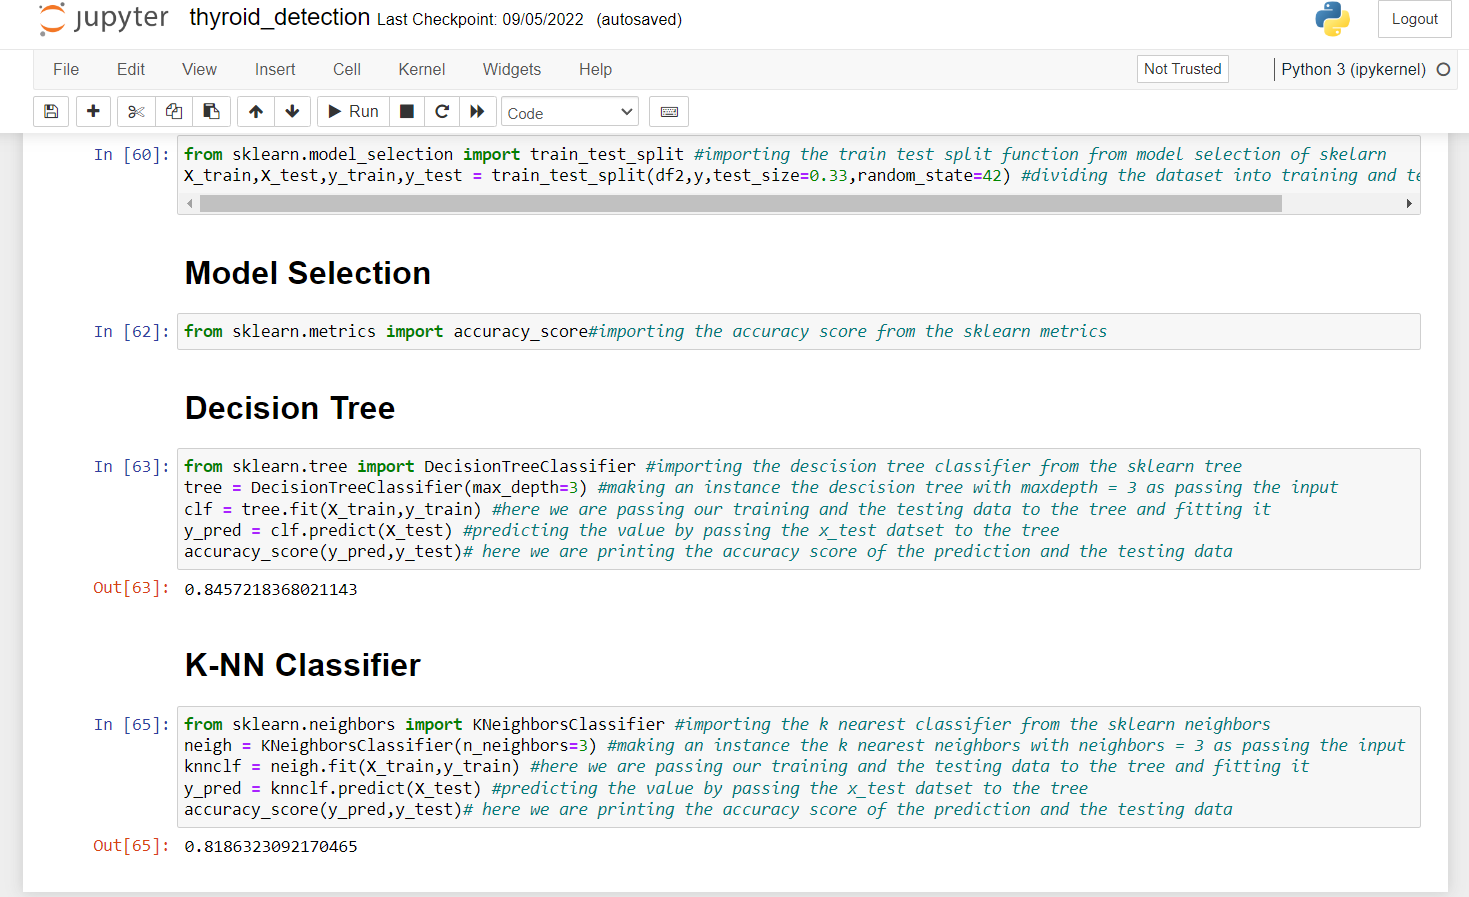
12. Here we are dividing our dataset into training and testing dataset.
from sklearn.model_selection import train_test_split #importing the train test split function from model selection of skelarn
X_train,X_test,y_train,y_test = train_test_split(df2,y,test_size=0.33,random_state=42) #dividing the dataset into training and testing dataset

from sklearn.metrics import accuracy_score#importing the accuracy score from the sklearn metrics
13. Here we import the Decision Tree Classifier from sklearn and we pass our training and testing dataset into it and then we print the accuracy of the model.
from sklearn.tree import DecisionTreeClassifier #importing the descision tree classifier from the sklearn tree
tree = DecisionTreeClassifier(max_depth=3) #making an instance the descision tree with maxdepth = 3 as passing the input
clf = tree.fit(X_train,y_train) #here we are passing our training and the testing data to the tree and fitting it
y_pred = clf.predict(X_test) #predicting the value by passing the x_test datset to the tree
accuracy_score(y_pred,y_test)# here we are printing the accuracy score of the prediction and the testing data
14. Here we are importing the K Nearest Neighbor Classifier from sklearn and we are passing our training and testing dataset into it and then we print the accuracy of the model.
from sklearn.neighbors import KNeighborsClassifier #importing the k nearest classifier from the sklearn neighbors
neigh = KNeighborsClassifier(n_neighbors=3) #making an instance the k nearest neighbors with neighbors = 3 as passing the input
knnclf = neigh.fit(X_train,y_train) #here we are passing our training and the testing data to the tree and fitting it
y_pred = knnclf.predict(X_test) #predicting the value by passing the x_test datset to the tree
accuracy_score(y_pred,y_test)# here we are printing the accuracy score of the prediction and the testing data
Summary
In this Machine Learning project, we develop a hypo Thyroid Disease detection using the Decision Tree and KNN Classifier. We hope you have learned something new from this project.
Hello,
I wanna understand clearly how to detect the thyroid using ML, but while reading this I didn’t get clarity on this topic so can I get any video or some more information regarding this detection? It’s better with this if I got the HTML and CSS files also.
Thank you.
did i get the html and css files and video about the project
did i get the html and css files and video about the project