Machine Learning Rainfall Prediction Project
FREE Online Courses: Dive into Knowledge for Free. Learn More!
Rainfall Prediction Project
The state of Tamil Nadu, located in southern India, experiences significant variations in rainfall patterns throughout the year. Reliable and accurate rainfall predictions are crucial for various sectors such as agriculture, water resource management, and disaster preparedness.
Therefore, this project aims to develop a rainfall prediction model specifically tailored for Tamil Nadu. To create an effective rainfall prediction model, historical rainfall data spanning the years 1901 to 2015 is utilized; this dataset provides a comprehensive understanding of the rainfall patterns and trends observed in Tamil Nadu over a long period of time. By leveraging this valuable information, we aim to train a machine-learning model that can accurately predict rainfall in the months of February, March, April, and May. By accomplishing these objectives, this project on Project Gurukul Platform aims to develop an accurate and reliable model for detecting Rainfall.
About Dataset
The dataset utilized in this project encompasses information regarding the distribution of rainfall in various Indian states, spanning from the year 1901 to 2015. Each state’s dataset contains rainfall distribution data for every month during this time period. However, there are certain months and states where the information is not available, marked as “NA” during classification, and these entries are not taken into consideration. The dataset is structured in a manner where India is divided into 36 regions. Some union territories are considered as part of particular states, and larger states are further divided into regions. The data is stored in comma-separated values (CSV) format, and the pandas’ package in Python is employed to read and manipulate the data efficiently.
The link to the Rainfall Data Dataset
Tools and libraries used
1. Pandas: A powerful data manipulation library in Python for data analysis and manipulation.
2. Seaborn: A statistical data visualization library that provides a high-level interface for creating informative and attractive statistical graphics.
3. Matplotlib: A comprehensive plotting library for creating static, animated, and interactive visualizations in Python.
4. Scikit-learn: A machine learning library that provides various algorithms and tools for data preprocessing, model selection, training, evaluation, and more.
Download Machine Learning Rainfall Prediction Project
Please download the source code of Machine Learning Rainfall Prediction Project: Machine Learning Rainfall Prediction Project Code.
Steps to Develop Prediction of Rainfall in Machine Learning
Step1: Importing the required libraries
Step2: Reading the dataset
Step3: Data Preprocessing
Step 4: Splitting the dataset into features and labels
Step 5: Creating the random forest regression model
Step 6: Training the model
Step 7: Predicting the labels for the testing set
Step 8: Evaluating the model performance by printing the mean absolute error
Step 9: Visualization
1. Importing the required libraries
import pandas as pd
import numpy as np
from sklearn.model_selection import train_test_split
from sklearn.metrics import mean_absolute_error
from sklearn.ensemble import RandomForestRegressor
import matplotlib.pyplot as plt
This code imports various libraries and modules needed for the pipeline, including NumPy, Pandas, Seaborn, Matplotlib, and sci-kit-learn (sklearn), which contains the Random Forest Regressor model and other machine learning tools.
2. Reading the dataset
df = pd.read_csv("rainfall in india 1901-2015.csv").fillna(value=0)
This line reads in the Rainfall dataset from a directory and stores it in a Pandas DataFrame called df.
3. Data Preprocessing
tn_df = df[df['SUBDIVISION'] == "TAMIL NADU"]
data = np.asarray(tn_df[['FEB', 'MAR', 'APR', 'MAY']])
# Prepare the input and target variables
features, target = None, None
for i in range(data.shape[1] - 3):
    if features is None:
        features = data[:, i:i+3]
        target = data[:, i+3]
    else:
        features = np.concatenate((features, data[:, i:i+3]), axis=0)
        target = np.concatenate((target, data[:, i+3]), axis=0)
These lines of code extract the input features and target variables from the data array. The data array contains the rainfall data for the months of February, March, April, and May. The loop creates overlapping sequences of 3 consecutive months as the input features and the next month as the target variable. This allows the data to be prepared for training a machine learning model.
4. Splitting the dataset into features and labels
X_train, X_test, y_train, y_test = train_test_split(features, target, test_size=0.2, random_state=42)
These lines split the data into training and testing sets using the train_test_split() function from scikit-learn, with a test size of 20%.
5. Creating the random forest regression model
rf = RandomForestRegressor(n_estimators=100, max_depth=10, n_jobs=1)
This line creates a Random Forest Regressor model with a random state of 42.
6. Training the model
rf.fit(X_train, y_train)
This line fits the model on the training data.
7. Predicting the labels for the testing set
# Make predictions on the test set
y_pred = rf.predict(X_test)
This line uses the predict method to predict the labels for the testing set, which is stored in X_test. The predicted labels are stored in y_pred.
8. Evaluating the model performance by printing the mean absolute error
# Calculate the mean absolute error
mae = mean_absolute_error(y_test, y_pred)
print(mae)
Output:
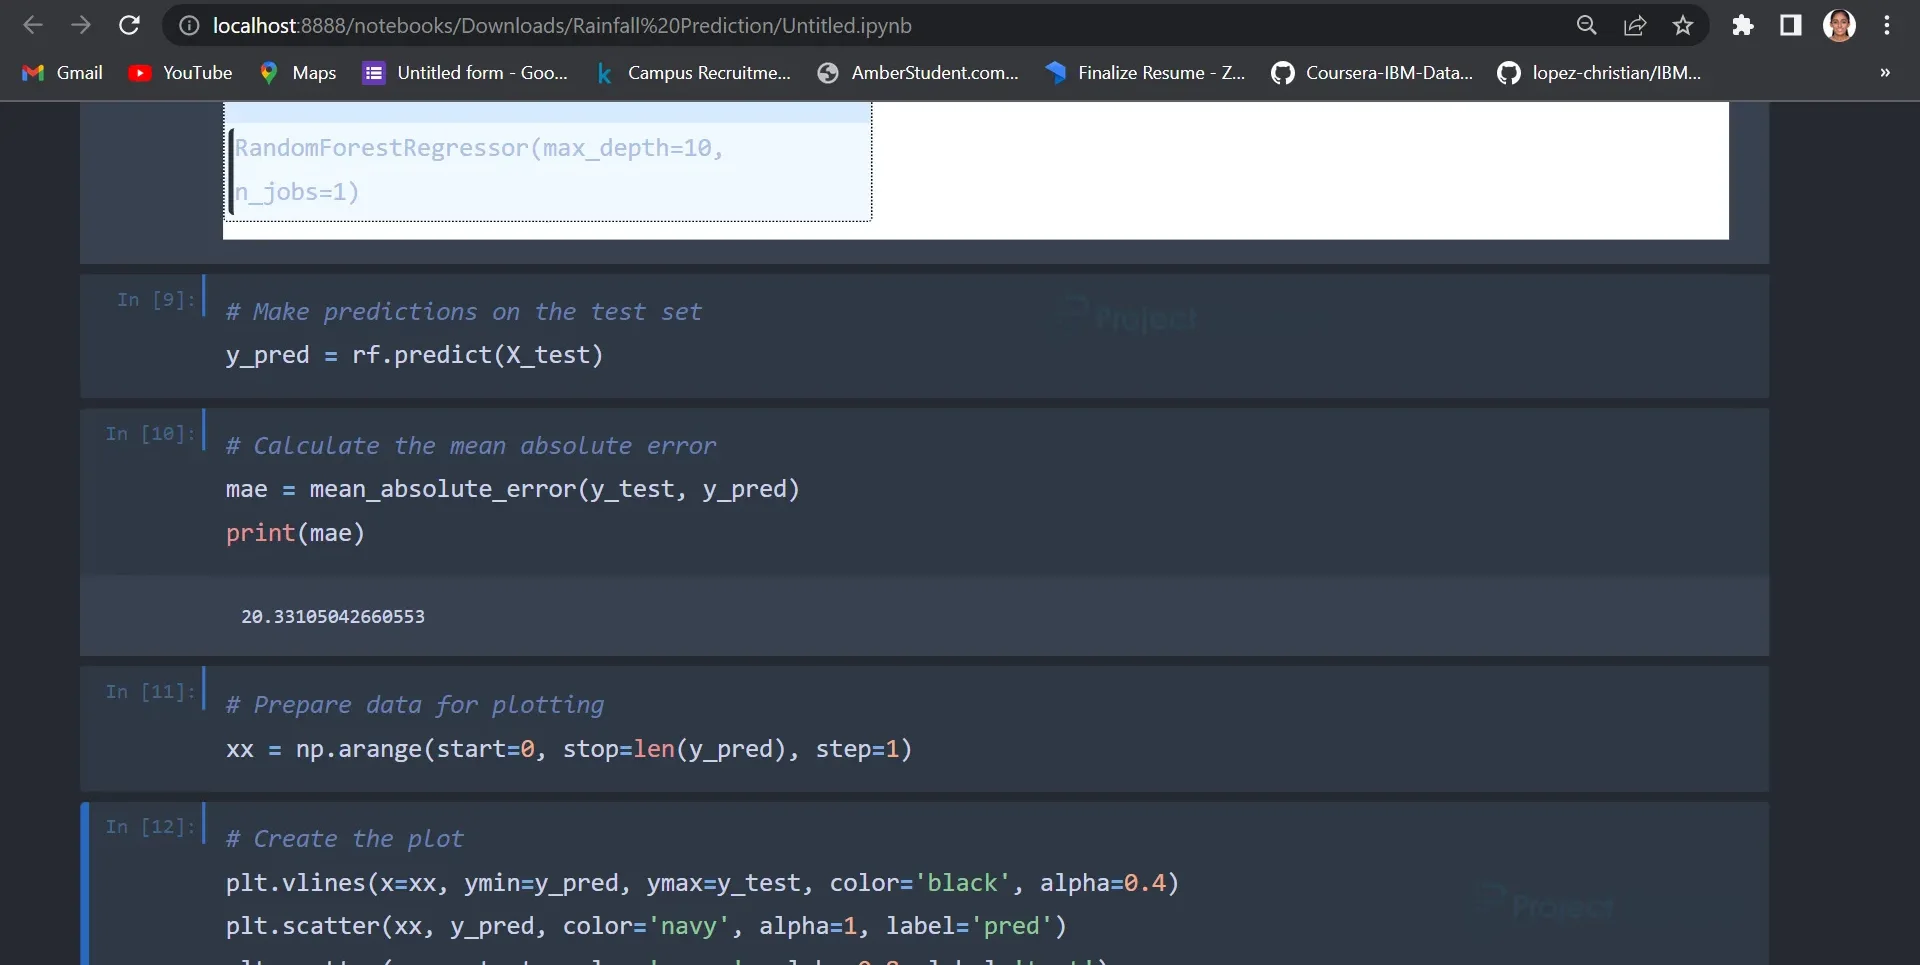
This code block calculates and prints the model’s performance metrics. It uses Mean Absolute Error using sklearn.metrics library.
The Mean Absolute Error calculated is 20.33
9. Visualization`# Prepare data for plotting
xx = np.arange(start=0, stop=len(y_pred), step=1)
# Create the plot
plt.vlines(x=xx, ymin=y_pred, ymax=y_test, color='black', alpha=0.4)
plt.scatter(xx, y_pred, color='navy', alpha=1, label='pred')
plt.scatter(xx, y_test, color='green', alpha=0.8, label='test')
plt.scatter(xx, np.abs(y_pred - y_test), color='gold', label='abs_error', marker='x')
plt.legend()
To visualize the model’s predictions, a plot is created using the ‘matplotlib.pyplot’ module. The plot shows vertical lines representing the indices of the test samples, with the predicted rainfall values (‘pred’) shown as navy dots, the actual rainfall values (‘test’) shown as green dots, and the absolute errors (‘abs_error’) shown as gold crosses.
Output:

Summary
In this project, a rainfall prediction model for Tamil Nadu using historical rainfall data has been developed. The model is based on the RandomForestRegressor algorithm and shows promising results in predicting rainfall for the months of February, March, April, and May. The mean absolute error metric is used to evaluate the model’s performance. The visualization provides a visual representation of the model’s predictions and their comparison to the actual rainfall values.
This project can be further extended by incorporating more advanced machine learning techniques, exploring additional features, and considering other factors, such as geographical and climatic data, to improve the accuracy of rainfall predictions.