Machine Learning Project – Black Friday Sales Prediction
We offer you a brighter future with FREE online courses - Start Now!!
The Black Friday Sales Prediction project aims to analyze and predict consumer purchasing behavior during the annual Black Friday sales event. Black Friday is a significant shopping day, with widespread discounts and promotions across various retail sectors. This Machine Learning Black Friday Sales Prediction project leverages data science and machine learning techniques to gain insights into customer preferences and behaviours, ultimately creating a predictive model for forecasting sales.
About Dataset
The project utilizes a dataset sourced from a CSV file hosted on GitHub. This dataset contains information about Black Friday sales, including customer details, products, and purchase amounts. Key features include customer demographics (such as gender, age, marital status), product, and city categories. The dataset is the foundation for exploratory data analysis (EDA) and machine learning model training.
The link to Dataset can be found: BlackFridayData
Tools and Libraries Used in ML Black Friday Sales Prediction Project
NumPy:
- NumPy is a powerful numerical computing library in Python.
- It supports large, multi-dimensional arrays and matrices and mathematical functions to operate on these arrays.
Pandas:
- Pandas is a data manipulation and analysis library.
- It provides data structures like Series and DataFrame, essential for handling and analyzing structured data.
Matplotlib:
- Matplotlib is a widely used plotting library in Python.
- It allows the creation of various plots and charts to visualize data distributions and patterns.
Seaborn:
- Seaborn is a statistical data visualization library based on Matplotlib.
- It simplifies the creation of aesthetically pleasing statistical graphics and enhances Matplotlib’s capabilities.
Scikit-Learn:
- Scikit-Learn is a machine-learning library in Python.
- It provides tools for data preprocessing, model selection, and evaluation. In this code, LabelEncoder is used for encoding categorical variables, and train_test_split is used to split the data into training and testing sets.
XGBoost:
- XGBoost is an open-source machine-learning library that provides an efficient and scalable implementation of gradient boosting.
- This code is used for regression tasks to predict the purchase amount during Black Friday sales.
Other Python Libraries:
- The math module is a standard Python library providing mathematical functions. In this code, sqrt is used to calculate the square root.
Prerequisites For Machine Learning Black Friday Sales Prediction Project
1. Data Analysis and Data Wrangling: Ability to clean, preprocess, and analyze large datasets. Proficiency in tools like Python (with libraries like Pandas) or R for data manipulation.
2. Statistical Analysis: Understanding statistical concepts and techniques such as hypothesis testing, regression analysis, time series analysis, and forecasting methods.
3. Machine Learning: Knowledge of machine learning algorithms such as linear regression, decision trees, random forests, gradient boosting, and neural networks. Understanding when and how to apply them for regression or classification tasks.
4. Feature Engineering: Ability to identify relevant features (such as historical sales data, customer demographics, product attributes, and promotional activities) and engineer new features from existing data to improve model performance.
5. Model Evaluation and Validation: Familiarity with techniques for evaluating and validating machine learning models, including cross-validation, hyperparameter tuning, and performance metrics such as RMSE (Root Mean Square Error), MAE (Mean Absolute Error), or MAPE (Mean Absolute Percentage Error).
6. Time Series Analysis: Understanding time series data and techniques specific to forecasting, such as ARIMA (AutoRegressive Integrated Moving Average), Exponential Smoothing methods, or Prophet.
7. Big Data Technologies: Knowledge of distributed computing frameworks like Apache Spark or Hadoop for handling large-scale data processing if dealing with massive datasets.
8. Database and SQL: Proficiency in SQL for querying databases to extract relevant data for analysis and model training.
9. Data Visualization: Ability to communicate insights effectively through data visualization using tools like Matplotlib, Seaborn, Plotly, or Tableau.
10. Programming Skills: Proficiency in programming languages commonly used in data science such as Python or R. Additionally, familiarity with libraries and frameworks such as scikit-learn, TensorFlow, or PyTorch for machine learning and deep learning tasks.
Download Machine Learning Black Friday Sales Prediction Project.
Please download the source code of Machine Learning Black Friday Sales Prediction: Machine Learning Black Friday Sales Prediction Project Code.
Steps to Predict Black Friday Sales Using Machine Learning
The provided code performs several tasks related to analyzing and modeling Black Friday sales data. Let’s break down the code and explain each step:
1. Data Loading: Libraries such as NumPy, Pandas, Matplotlib, and Seaborn are imported. The Black Friday sales data is loaded from a CSV file hosted on GitHub using Pandas.
import numpy as np
import pandas as pd
import matplotlib.pyplot as plt
import seaborn as sns
data = pd.read_csv("https://raw.githubusercontent.com/nanthasnk/Black-Friday-Sales-Prediction/master/Data/BlackFridaySales.csv")
2. Data Exploration: Checking for missing values in the dataset and calculating each column’s percentage of missing values.
data.isnull().sum()
   data.isnull().sum()/data.shape[0]*100
3. Visualization: Visualizing the distribution of the ‘Gender’ column using a countplot.
sns.countplot(data['Gender'])
plt.show()
Output:
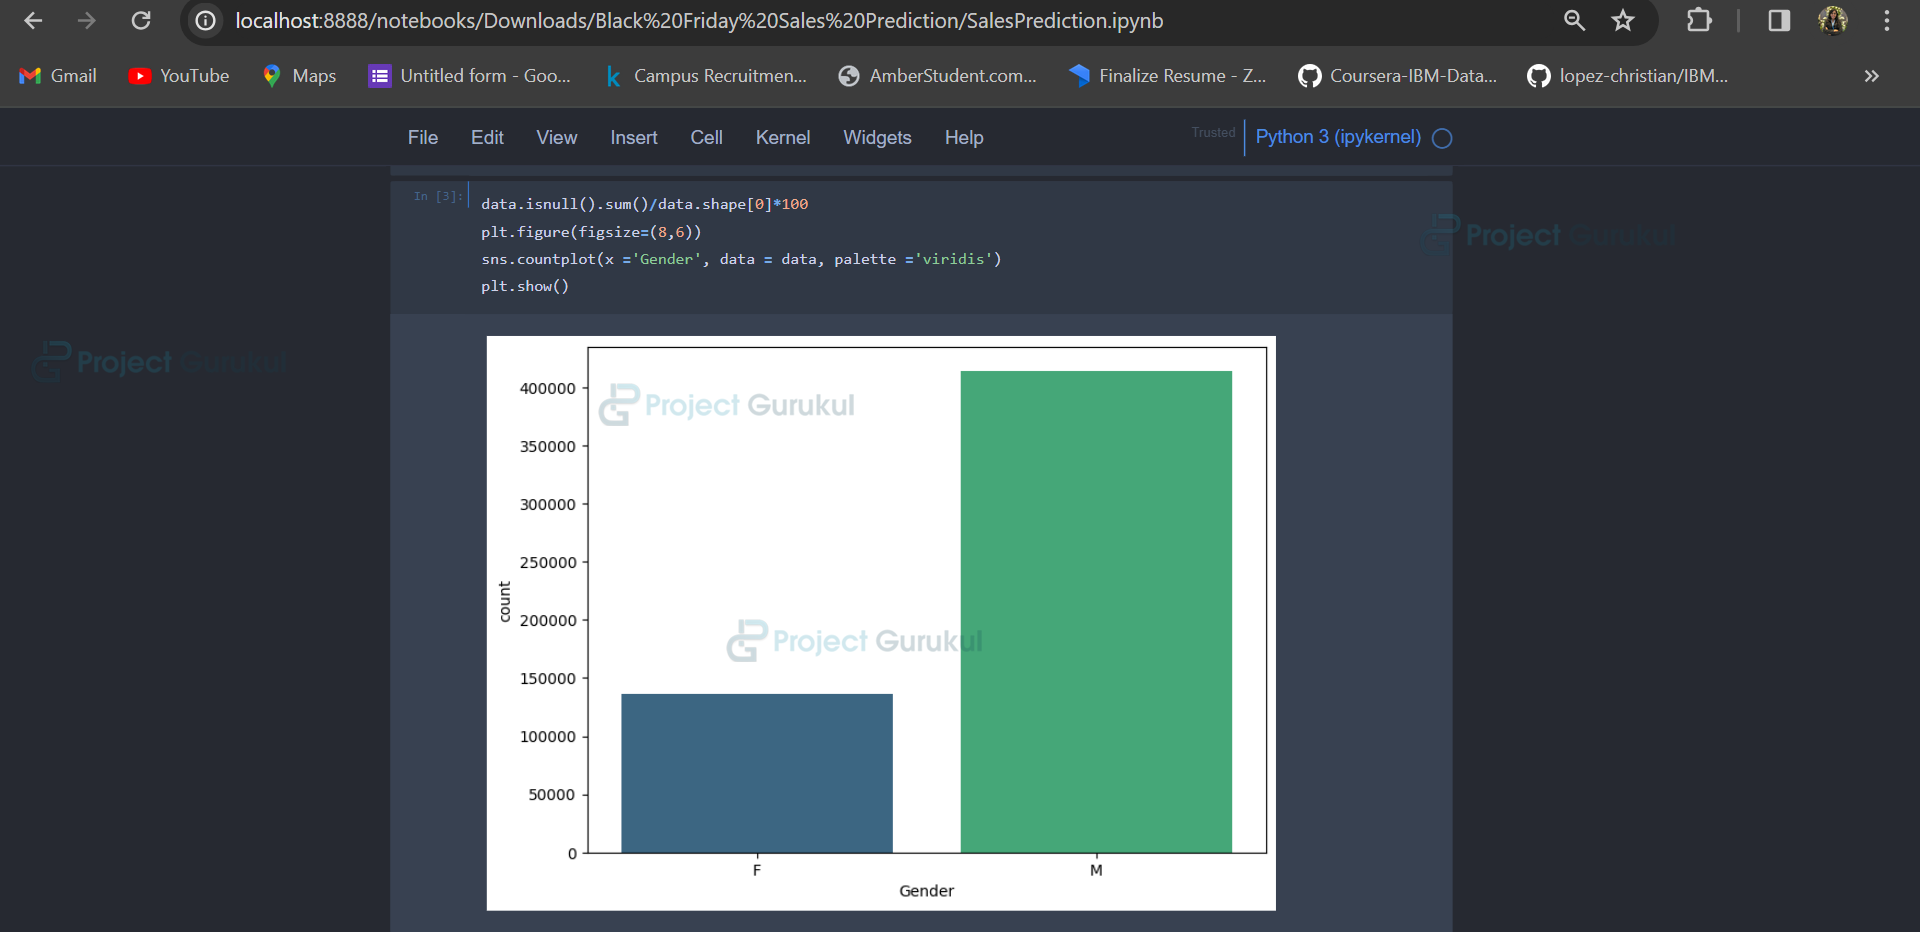
Displaying the percentage distribution of genders.
data['Gender'].value_counts(normalize=True)*100
Output:
Analyzing the average purchase amount based on gender.
data.groupby("Gender").mean()["Purchase"]
Output:
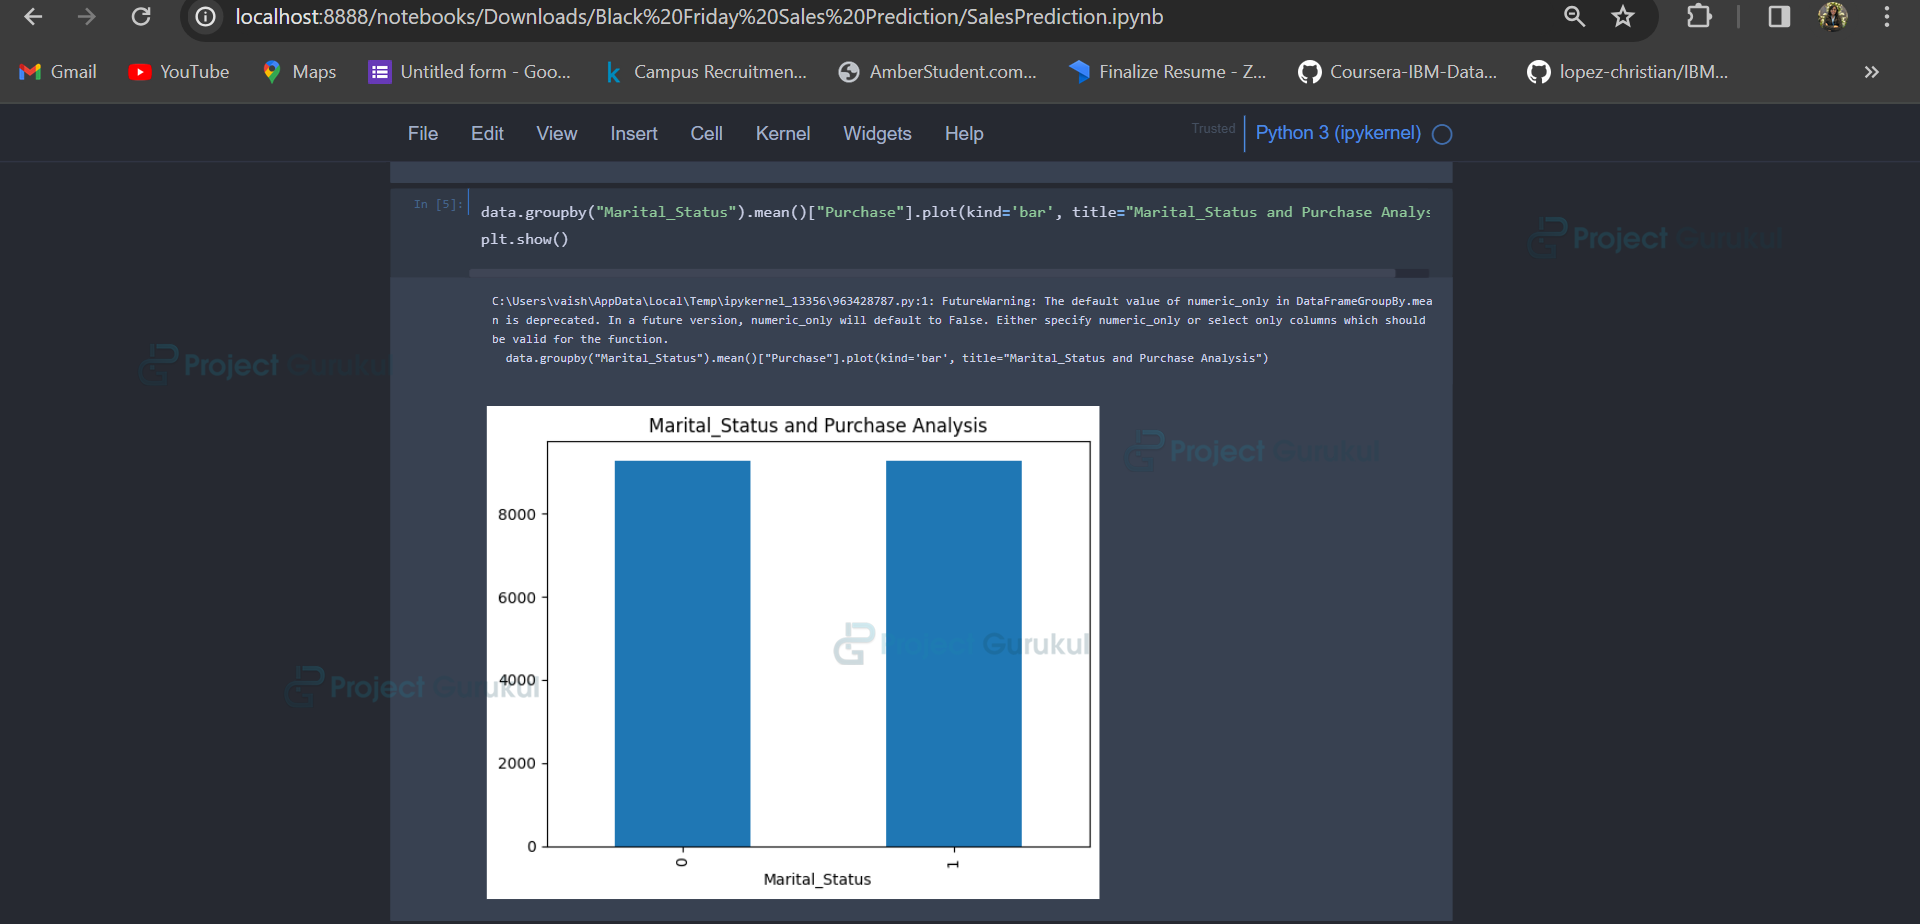
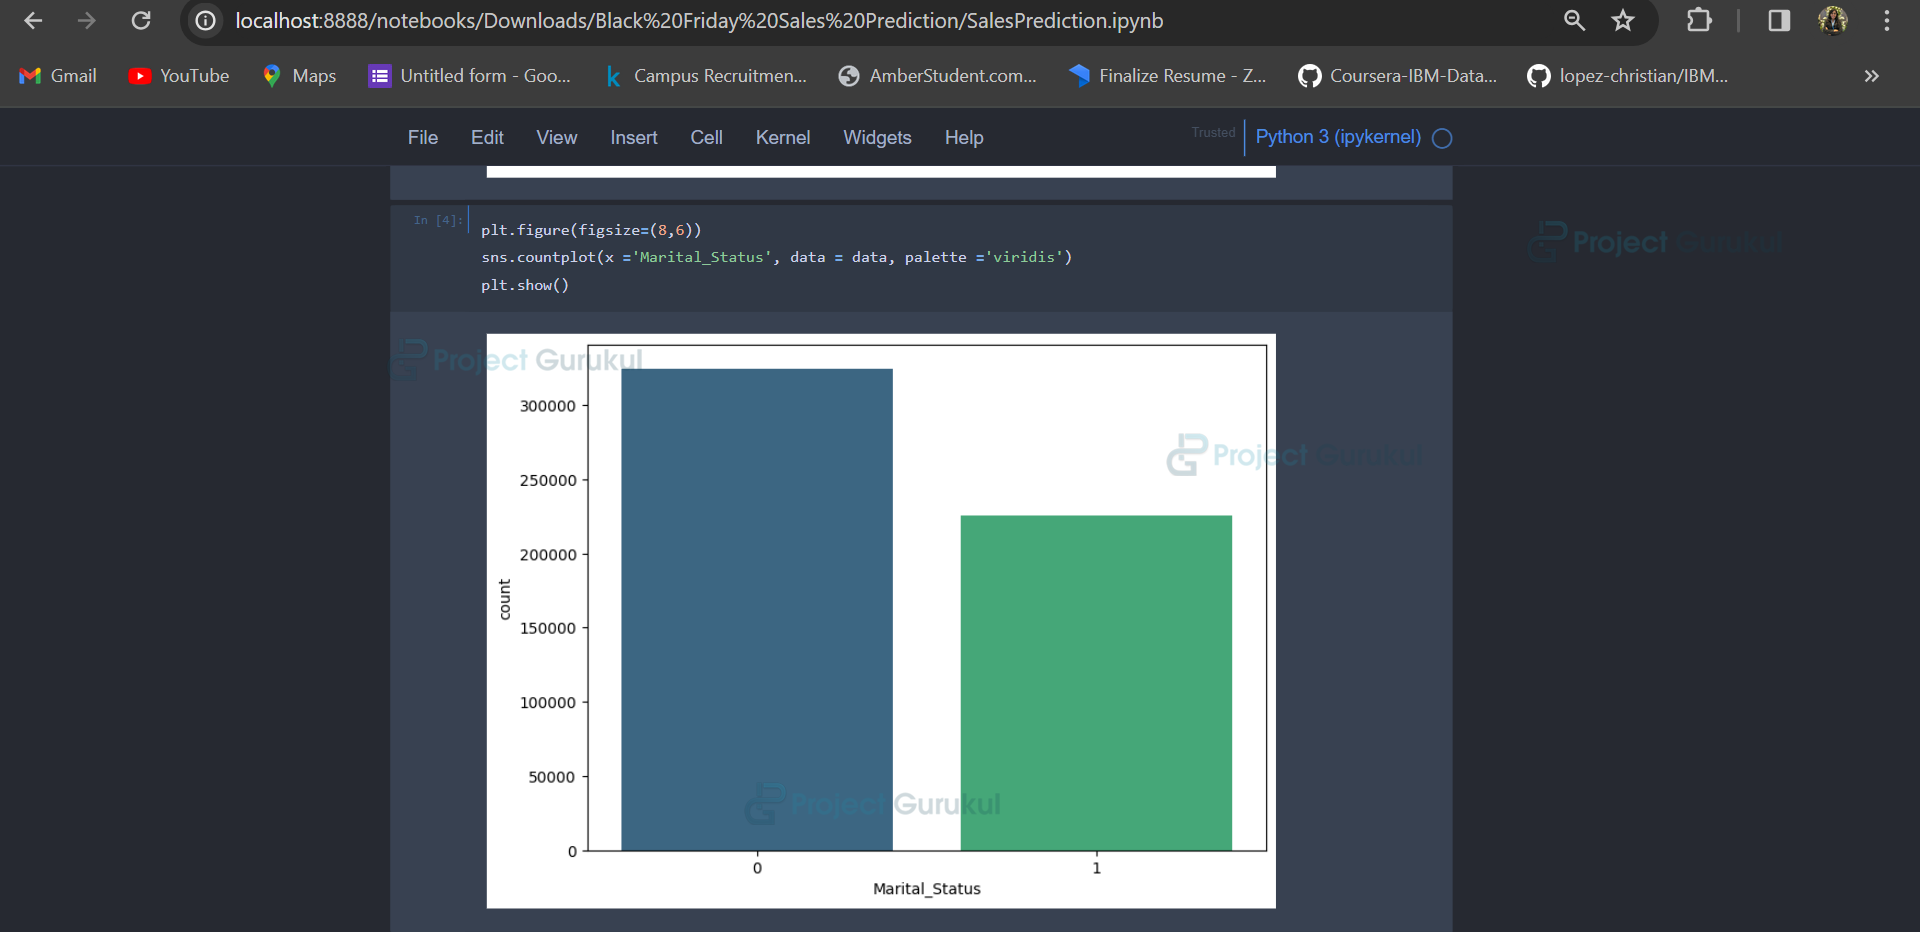
Similar visualizations and analyses can be done for ‘Marital_Status’, ‘City_Category’, and ‘Age’.
4. Data Preprocessing: Label encoding categorical variables (‘Gender’, ‘Age’, ‘City_Category’) for preparing the data for machine learning models. Displaying the first few rows of the modified DataFrame.
from sklearn.preprocessing import LabelEncoder
lr = LabelEncoder()
df['Gender'] = lr.fit_transform(df['Gender'])
df['Age'] = lr.fit_transform(df['Age'])
df['City_Category'] = lr.fit_transform(df['City_Category'])
df.head()
Handling missing values in ‘Product_Category_2’ and ‘Product_Category_3’ by filling them with 0 and converting the columns to integers. Dropping ‘User_ID’ and ‘Product_ID’ columns.
df['Product_Category_2'] = df['Product_Category_2'].fillna(0).astype('int64')
df['Product_Category_3'] = df['Product_Category_3'].fillna(0).astype('int64')
df = df.drop(["User_ID","Product_ID"],axis=1)
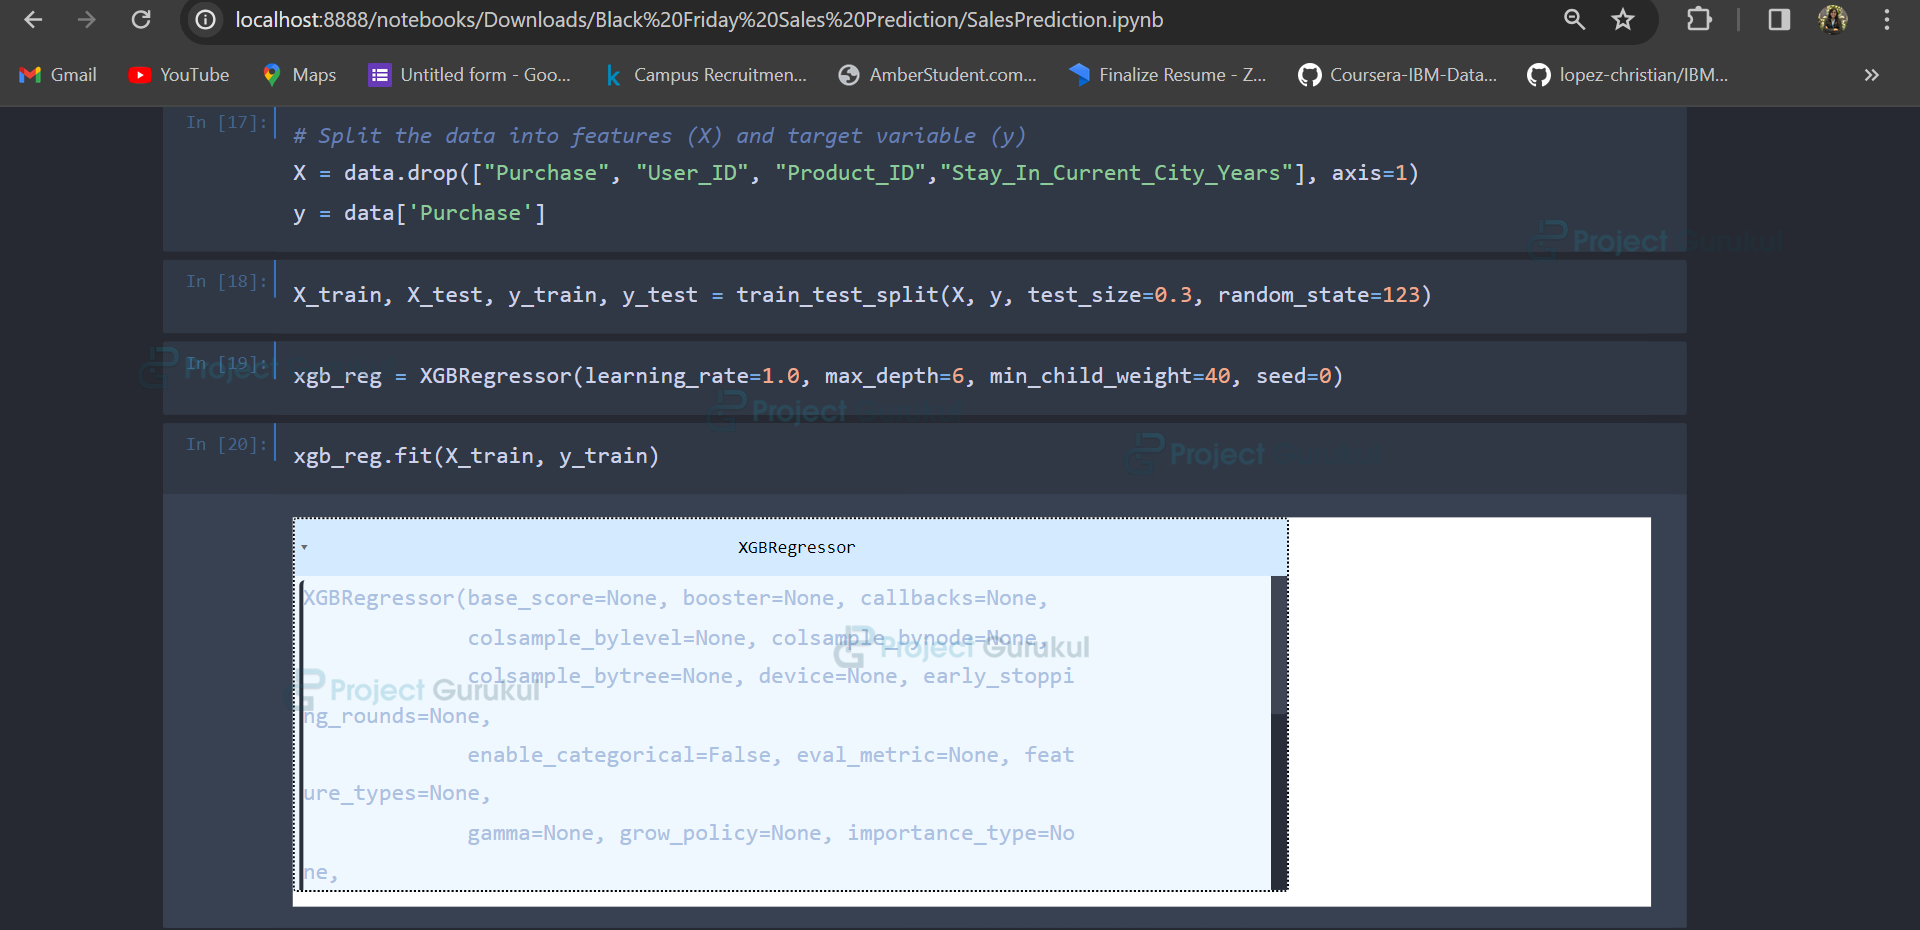
5. Modeling: Preparing features (X) and target variable (y) for modeling.
X = df.drop("Purchase", axis=1)
y = df['Purchase']
Splitting the data into training and testing sets.
from sklearn.model_selection import train_test_split
X_train, X_test, y_train, y_test = train_test_split(X, y, test_size=0.3, random_state=123)
Using XGBoost to create a regression model and make predictions on the test set.
from xgboost.sklearn import XGBRegressor
xgb_reg = XGBRegressor(learning_rate=1.0, max_depth=6, min_child_weight=40, seed=0)
  xgb_reg.fit(X_train, y_train)
  xgb_y_pred = xgb_reg.predict(X_test)
Output:
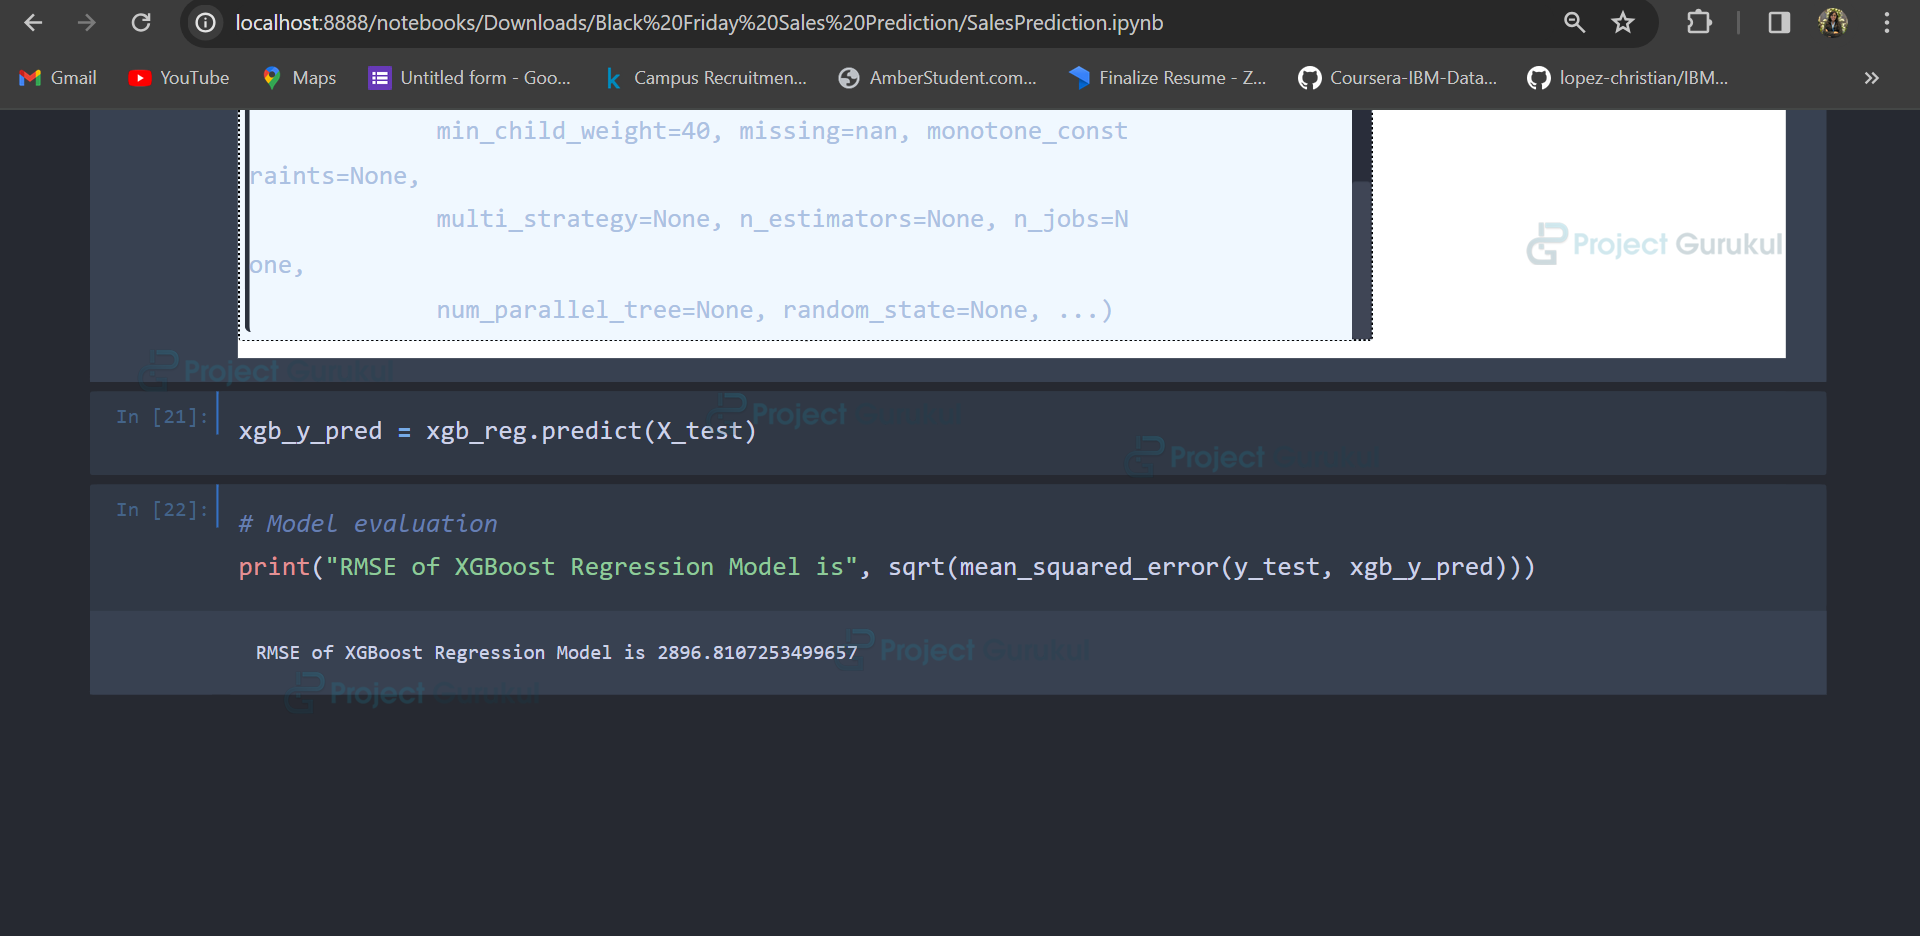
6. Model Evaluation: Evaluate the model’s performance using metrics such as Mean Absolute Error (MAE), Mean Squared Error (MSE), and Root Mean Squared Error (RMSE). Also, printing the RMSE value.
The rmse value is 2896.8107253499657.
from sklearn.metrics import mean_absolute_error, mean_squared_error, r2_score
   from math import sqrt
   print("RMSE of XGBoost Model is ", sqrt(mean_squared_error(y_test, xgb_y_pred)))
Output:
This code performs data exploration, visualization, preprocessing, and modeling tasks for Black Friday sales data using XGBoost. The final step involves evaluating the model’s performance using regression metrics. The provided code performs several tasks related to analyzing and modeling Black Friday sales data. I’ll break down the code and explain each part:
This code performs data exploration, visualization, preprocessing, and modeling tasks for Black Friday sales data using XGBoost. The final step involves evaluating the model’s performance using regression metrics.
Summary
This project on ProjectGurukul aimed to analyze consumer purchasing behavior during the annual Black Friday sales event using data science and machine learning techniques. Key tools and libraries such as NumPy, Pandas, Matplotlib, Seaborn, Scikit-Learn, and XGBoost were employed for data manipulation, visualization, preprocessing, and modeling.
The project involved exploring the dataset, visualizing purchase distributions across demographics, preprocessing data through label encoding, and applying XGBoost for regression tasks. Model performance was evaluated using metrics like MAE, MSE, and RMSE. The results indicated that the XGBoost model successfully predicted Black Friday sales, providing valuable insights for businesses in optimizing sales strategies, inventory management, and targeted marketing efforts during similar sales events.
You can check out more such machine learning projects on ProjectGurukul.