Fake Currency Detection using Machine Learning
FREE Online Courses: Transform Your Career – Enroll for Free!
With this Machine Learning Project, we will be building a fake currency detection system for detecting fake currency and real currency. In today’s time, the production and circulation of inauthentic currency notes have been increasingly sophisticated. That’s why there needs to be a system to check whether a currency is fake or real.
So, let’s build this detection system in this project.
Fake Currency Detection System
So, what is this Fake Currency Detection System?
A fake currency detection system as the name suggests will find whether a note given to you by any person is real or fake. This system will be very useful because the circulation of inauthentic money is increasing day by day. So there needs to be a system that will prevent this from happening.
This system can be used by banks and common people. This will help the bank identify fake notes and real notes. This can also be used by common people to prevent them from being thug.
Methodology
- Image Acquisition: The image is provided to the model. There should be two images – a note which you want to detect and a corresponding real note.
- RGB to GRAYSCALE: The RGB image is converted into a GRAYSCALE image.
- Segmentation: The image is segmented to crop Gandhi Ji image and thin strip image.
- Feature Measurement: Feature measurement is done to measure the number of lines on a thin strip. This is a really lengthy process.
- Finding Correlation: We find a correlation between Gandhi Ji’s image on the original note and a fake note. If the result is greater than 0.5 then we will consider it legitimate otherwise the currency is fake.
- Classification: Finally, we will classify the image as real or fake.
The Model Architecture
This model we will build will use a grayscale image, segmentation, and feature extraction.
So, how we will build this model?
We are going to use OpenCV in this project because this library contains some of the pre-built functions to work with images. To check whether the currency is fake or real, we will take a real note and a fake note as input an image in the system. The input images given to the system will be converted into grayscale images. We will use segmentation to segment out the image of Gandhi Ji and the thin strip on the note.
The idea is that we will compare the real and fake notes based on the image of Gandhi Ji and the thin strip present on the image. We will compare the image of Gandhi Ji and we will check whether the number of lines in the thin strip is equal to the number of lines in the thin strip.
The comparison of Gandhi Ji’s image is simple because we just have to find a correlation between two images using a correlation function. If the result of the correlation function is greater than 0.5 then Gandhi Ji is legitimate and we will check for a thin strip. Otherwise, the note is fake.
Now the main problem is to find the number of lines in thin strips. For that, we will convert the image into HSV(hue saturation value) image because it will be easy that way. Then we will segment the image to find the thin strip.
After that, we will apply a bwlabel function to find the number of connected components i.e. the number of lines in the thin strip.
In the end, we will just write small code to final check whether the currency is fake or real.
NOTE: We have just used two features i.e. Gandhi Ji image and thin strip. But there are a lot of other things on a real note like a unique number, bleed lines(using which a blind man can find what is the value of the currency), etc. For improving the model, you can try implementing these features by yourself.
Project Prerequisites
The requirement for this project is Python installed. You should also be familiar with libraries such as numpy and OpenCV. We will be using Jupyter Notebook for our project. You can use any other IDE for the project.
The required modules for this project are –
- OpenCV – pip install opencv-python
- Numpy – pip install numpy
That’s all we need for our detection system. Most of the functions that we will be using are already there in the OpenCV library. The rest of the functions we will create on our own.
Also to improve the performance, you can modify the functions on your own that we are gonna create.
Fake Currency Detection Project
The good news is that all we need for the dataset in this project is just two images. One is for real notes and the other is for fake notes. The images we have used in this project are provided along with the fake currency detection project code in the following link: Fake Currency Detection Dataset & Code
Steps to Implement Fake Currency Detection Project
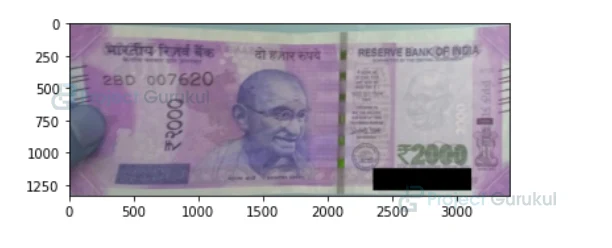
1. Import the Modules and read the real and fake images using openCV.
import cv2
import matplotlib.pyplot as plt
import numpy as np

A = cv2.imread('real.jpg')
P = cv2.imread('fake.jpg')
plt.imshow(A)
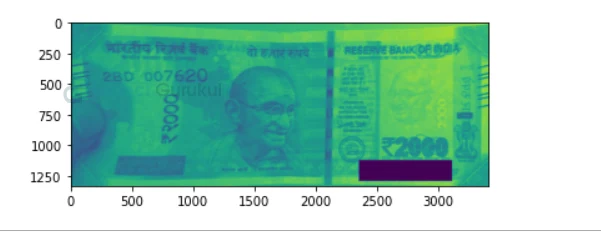
2. Here, we are converting the colored image into Black and White. Because it is easier to find important features of image when it is in black and white.
a = cv2.cvtColor(A, cv2.COLOR_BGR2GRAY)
p = cv2.cvtColor(P, cv2.COLOR_BGR2GRAY)

plt.imshow(a)
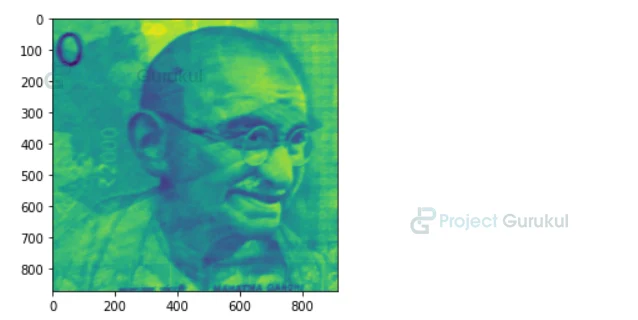
 3. Here, we are extracting the image of Gandhi Ji from the real note.
NOTE: every time you are extracting the image of Gandhi Ji, you need to adjust the coordinates.
a2tr = a[330:1200, 1016:1927]

plt.imshow(a2tr)
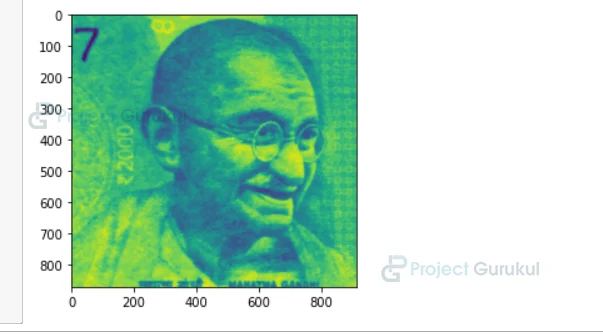
4. Here we are doing the same thing for fake note.
b2tr = p[170:1040, 716:1627]

plt.imshow(b2tr)
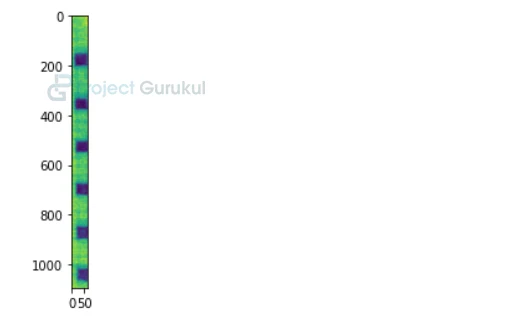
5. Here we are extracting the thin strip from real note.
print(a.shape)
a2_str = a[5:1100, 2080:2151]

plt.imshow(a2_str)

6. Here we are doing same thing for our fake note.
print(p.shape)
p2_str = p[5:1100, 1666:1729]

plt.imshow(p2_str)
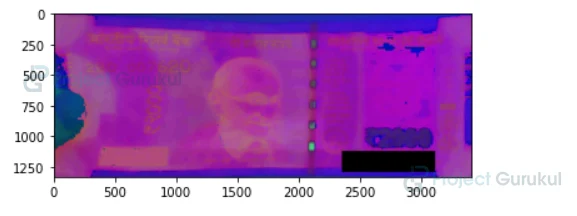
7. The image is being converted into HSV here. It is just a different format. HSV (Hue Saturation Value) is also a numeric measurement of the color of your image. The measurement is in degrees. In RGB, hue refers to the angle at which the colors lie.
hsvImageReal = cv2.cvtColor(A, cv2.COLOR_BGR2HSV)

hsvImageFake = cv2.cvtColor(P, cv2.COLOR_BGR2HSV)
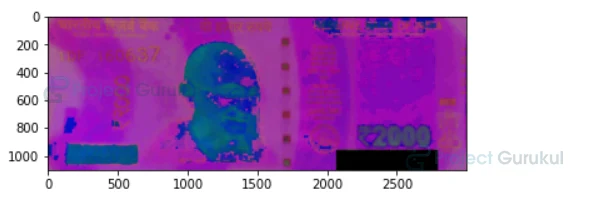
8. Here is the result.
plt.imshow(hsvImageReal)
plt.imshow(hsvImageFake)
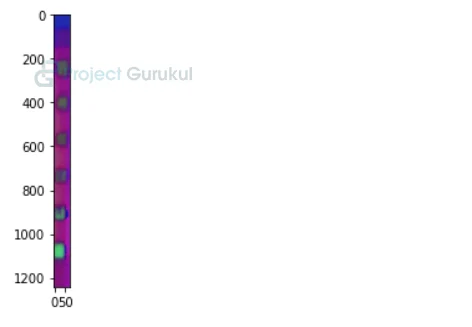
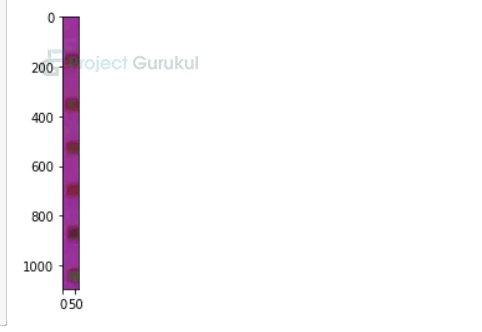
9. Here we are extracting the thin strip from our hsv image.
croppedImageReal = hsvImageReal[5:1100, 2080:2151]

plt.imshow(croppedImageReal)
10. Here we are doing same thing for our fake image.
croppedImageFake = hsvImageFake[5:1100, 1666:1729]

plt.imshow(croppedImageFake)
11. Here we are setting the thresh value and extracting only those values from the cropped image with value greater than satThresh and less than valThresh. Then we will take the ‘&’ of both values. This whole process is done to extract the lines in thin strip from thin strip image.
satThresh = 0.3
valThresh = 0.9

g = croppedImageReal[:,:,1]>satThresh
h = croppedImageReal[:,:,2] < valThresh

g1 = croppedImageFake[:,:,1]>satThresh
h1 = croppedImageFake[:,:,2] < valThresh

BWImageReal = g&h
BWImageFake = g1&h1
12. Bwareaopen is a function that will find the connectivity in an image. It will be used to find the number of lines from a thin strip. We will use it later in the process.
def bwareaopen(img, min_size, connectivity=8):

    # Find all connected components (called here "labels")
    num_labels, labels, stats, centroids = cv2.connectedComponentsWithStats(
        img, connectivity=connectivity)

    # check size of all connected components (area in pixels)
    for i in range(num_labels):
        label_size = stats[i, cv2.CC_STAT_AREA]

        # remove connected components smaller than min_size
        if label_size < min_size:
            img[labels == i] = 0

    return img
13. Here is the code for morphological extraction of the thin strip image. This is a very important step for extracting the number of lines in image.
binr = cv2.threshold(a2_str, 0, 255, cv2.THRESH_BINARY+cv2.THRESH_OTSU)[1]

# define the kernel
kernel = np.ones((3, 3), np.uint8)

# invert the image
invert = cv2.bitwise_not(binr)

# use morph gradient
BWImageCloseReal = cv2.morphologyEx(invert, cv2.MORPH_GRADIENT, kernel)
14. Here we are doing the same thing for fake note.
binr2 = cv2.threshold(p2_str, 0, 255, cv2.THRESH_BINARY+cv2.THRESH_OTSU)[1]

# define the kernel
kernel2 = np.ones((3, 3), np.uint8)

# invert the image
invert2 = cv2.bitwise_not(binr2)

# use morph gradient
BWImageCloseFake = cv2.morphologyEx(invert2, cv2.MORPH_GRADIENT, kernel2)
15. Here we are using our bwareaopen function for the thin strip.
areaopenReal = bwareaopen(BWImageCloseReal, 15);

areaopenFake = bwareaopen(BWImageCloseFake, 15);
16. Here is the code for the final counting of the number of lines in real note.
bw = areaopenReal

labels = np.zeros(bw.shape)
countReal = cv2.connectedComponentsWithStats(bw, labels,8);
17. Here is the code for the final counting of the number of lines in fake note.
bw2 = areaopenFake

labels2 = np.zeros(bw2.shape)
countFake = cv2.connectedComponentsWithStats(bw2, labels2,8);
18. Here we are defining a correlation function. This correlation function will be used for our Gandhi Ji image. We just want to check the correlation between the photo of Gandhi Ji on the real and the fake one. This will take two 2d matrices as input and will give us the result in number form between 0 and 1. If the result is greater than 0.5, then Gandhi Ji photo on a fake note is legitimate otherwise not.
def corr2(A, B):

    A_mA = A - A.mean(1)[:, None]
    B_mB = B - B.mean(1)[:, None]

    # Sum of squares across rows
    ssA = (A_mA**2).sum(1)
    ssB = (B_mB**2).sum(1)

    # Finally get corr coeff
    return np.dot(A_mA, B_mB.T) / np.sqrt(np.dot(ssA[:, None],ssB[None]))
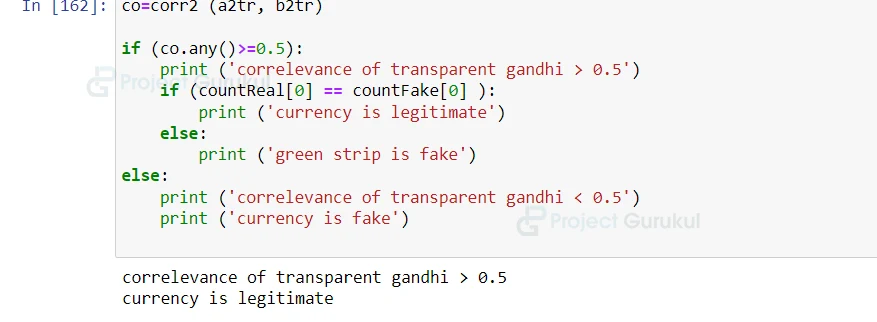
19. Here we are using our correlation function. Also, we are writing our code to check if the correlation value is greater than 0.5 or not. If it is greater than 0.5 then we are checking if the number of lines is equal or not.
co=corr2 (a2tr, b2tr)

if (co.any()>=0.5):
    print ('correlevance of transparent gandhi > 0.5')
    if (countReal[0] == countFake[0] ):
        print ('currency is legitimate')
    else:
        print ('green strip is fake')
else:
    print ('correlevance of transparent gandhi < 0.5')
    print ('currency is fake')
Summary
In this Machine Learning project, we built a fake currency detection system. We used grayscale conversion, segmentation, and feature extraction under image processing in our system to compare real and fake notes. We hope you learned some important topics in this article.
I need whole project with source code
I need the whole project with source code
can u send complete source code for this project
I need source code
its showing an error how to clear.
I need the report of this project can u provide
it was help full