Customer Segmentation with RFM Analysis using Machine Learning
FREE Online Courses: Elevate Skills, Zero Cost. Enroll Now!
With this Machine Learning Project, we will be doing a project on customer segmentation. In this project, we will be using the RFM analysis algorithm.
So, let’s build this system.
RFM Analysis
The top 20%, or best, consumers, are identified using RFM analysis, a three-dimensional method of categorizing or ranking customers. It is based on the 80/20 rule, according to which 80% of sales come from 20% of clients.
The pyramid model of customer segmentation is used to categorize customers and conduct analysis. The pyramid model groups clients according to how much money they bring in. Then, various analytics are applied to these categories or value segments. The benefit of this strategy is that it concentrates the analytics on terminology and categories that have direct economic value. The pyramid model has shown to be quite helpful for businesses, financial institutions, and banks.
Following are some problems that can be resolved by applying the model.
- Forecast for future sales.
- profitability for the client.
- predictions about how customers’ positions may change within the pyramid.
- recognizing the causes of these changes.
- preservation of the most crucial clients.
- energizing inactive clients.
The RFM approach was initially put forward by Stone and Bob (1989). Market segmentation can be done using the straightforward but efficient RFM method. Hughes uses historical data on customer buying patterns to define RFM analysis. The Recency (R) metric displays the time since the last purchase transaction. The frequency (F) is the total number of consumer purchase transactions. Over a specific time period, money spent by customers is referred to as monetary (M).
RFM analysis follows the tenet that products should be arranged according to recent sales, frequent sales, and overall expenditure. Real data set with the conversion of sales dates into one of five values, depending on the day of sale. The value of 4 is given for the next 20% of the data set, and so on, while the value of 1 refers to the oldest sales date. While the value of 1 denotes the earliest sales date, the value of 4 is provided for the following 20% of the data set, and so on.
In order to determine the frequency, the number of transactions within a given time frame, such as the number of transactions per month, is sorted in descending order. Value 5 provides up to 20% of the top data from the data collection. So that all of the actual data about the number of transactions are translated to values between 1 and 5 and the following 20% of the data set is assigned a value of 4, and so on. Money is ordered in descending order according to the average amount spent each month or year for all transactions. Up to 20% of the data set’s top data points are assigned a value of 5. 20% of the subsequent data are assigned values 4 and onward, transforming all actual data, including the amount of money into values 1 to 5. Finally, all R, F, and M values are combined to rank each product.
Fundamentally, RFM analysis contends that customers with high RFM scores ought to typically perform more transactions, which would increase the bank’s profit. Today, RFM analysis can be performed using Data Mining techniques like clustering. These techniques help determine and use the results of RFM analysis more effectively.
Model Architecture
There are three steps in the analysis process. Initially, RFM can be used as a conventional method. Before analysis, R, F, and M values should be calculated (Nimbalkar and Shah, 2013). R is the amount of time since the customer’s last activity. The number of activities performed by the consumer is F. M represents the client’s overall wealth expenditures. R, F, and M columns should be split into a certain number of intervals after calculating crisp values to score the consumers. In the literature, it is typical to favor 4 or 5 segments for each column. 5 segments are suggested in this investigation for a more thorough resolution. The subsequent steps define the RFM Analysis procedure:
Step 1: Determine each customer’s R-value by counting how many days have gone since the last activity.
Step 2: Count the number of activities to determine the F-value.
Step 3: Add up the customer-paid charges to determine the M-value.
Step 4: Arrange the customers in ascending order based on the R values. You should rank each 20% group of clients from 5 to 1, starting at the top.
Step 5: Sort the customers by the F values in descending order. Working your way down, rank each 20% group of clients from 5 to 1.
Step 6: Arrange the clients in descending order of M values. From 5 to 1, rank each 20% group of clients working your way down.
Step 7: Add up all of the scores to get the RFM Score.
Step 8: Segment data under the specified scale.
RFM analysis has been chosen in numerous situations due to its accessibility and simplicity. It does not, however, completely interpret conditional customer behavior. For instance, a customer’s conduct with an R-value of 30 days should be considered suspicious. For a high-volume buyer who prefers to purchase every three months, 30 days does not raise any red flags. The segmentation logic is another flaw. The number of categories into which the clients are divided is the same. There may be situations where, for instance, 10% of the customers have R-Score values of almost 3 days while the remaining customers’ scores are almost 20 days. In this situation, R scoring is meaningless because all customers, except 20% of the total, have an R-Score of 2 to 5, but only 10% of the customers, with recency of 3 days, have an R-Score of 1.
We have to keep all these parameters in mind and now let’s start working on the project.
Project Prerequisites
The requirement for this project is Python 3.6 installed on your computer. I have used a Jupyter notebook for this project. You can use whatever you want.
The required modules for this project are –
- Pandas(1.5.0) – pip install pandas
- DateTime(4.7.0) – pip install datetime
That’s all we need for our project.
Customer Segmentation with RFM Analysis
We provide the dataset and customer segmentation project code for this project that will be required later in this project. Please download the dataset and project source code from the following link: Customer Segmentation Project
Steps to Implement
Following are the steps to implement Customer Segmentation with RFM Analysis project:
1. Import the modules and the libraries. For this project, we are importing the libraries pandas. Here we also read our dataset, and we are saving it into a variable.
import datetime as dt #improting the datetime library
import pandas as pd #importing the pandas library

dataframe = pd.read_excel("dataset.xlsx", sheet_name="Year 2010-2011")#Loading the dataset
dataframe.head()#printing the dataset
2. Here, we are checking the number of null observations in the dataset, especially in the Customer ID column. Since the analysis will be consumer-based, we need to remove these observations from the dataset. Therefore, we will eliminate these observations in the next step.
print(dataframe.shape)#printing the shape of the dataset

print(dataframe.dtypes)#printing the datatype of the column

print(dataframe.isnull().sum())#printing the number of null values per column

print(dataframe.quantile([0, 0.05, 0.50, 0.95, 0.99, 1]).T)#printing the quantile of the dataframe
3. Here, we are defining the functions for outliers. We have also defined the function to replace outliers. Then we call these functions on our dataset. Then we write a function to prepare the data.
def rem_outlier(df, var):
    q1 = df[var].quantile(0.01)
    q3 = df[var].quantile(0.99)
    iq = q3 - q1
    upper = q3 + 1.5 * iq
    lower = q1 - 1.5 * iq
    return lower, upper

def rep_outlier(df, var):
    lower, upper= rem_outlier(df, var)

    df.loc[(df[var] > upper), var] = upper

rep_outlier(dataframe, "Quantity")
rep_outlier(dataframe, "Price")

dataframe.describe([0.01,0.25,0.50,0.75,0.99]).T#here we are checking data

dataframe["TotalPrice"] = dataframe["Quantity"] * dataframe["Price"]

cur_date= dt.datetime(2011, 12, 11)
print(f"max invoice: {dataframe.InvoiceDate.max()} \n date: {cur_date}")
4. Here, we are sorting the data according to customer ID. After this, we call our RFM function on our dataset for Customer Segmentation with RFM Analysis.
data_rfm.columns = ['Recency', 'Frequency', "Monetary"]#taking the Recency, Frequency and monetary into data_rfm
data_rfm.reset_index(inplace=True)#reseting the index of the data_rfm
data_rfm.head()#printing the head of the rfm

data_rfm["RecencyScore"] = pd.qcut(rfm["Recency"], 5, labels=[5, 4, 3, 2, 1]) #taking Recency Score
data_rfm["FrequencyScore"] = pd.qcut(rfm["Frequency"].rank(method="first"), 5, labels=[1, 2, 3, 4, 5])#taking Frequency Score
data_rfm["MonetaryScore"] = pd.qcut(data_rfm["Monetary"], 5, labels=[1, 2, 3, 4, 5]) #taking Monetary Score

# Concating scores and assign it to new column:
data_rfm["RFM_SCORE"] = (data_rfm['RecencyScore'].astype(str) +
                    data_rfm['FrequencyScore'].astype(str) +
                    data_rfm['MonetaryScore'].astype(str)) #here we are concatenating the scores and assigning it to new column
5. Here, we are assigning segments to our RFM dataset. After then, we find the Customer Segmentation with RFM Analysis
segment = {
r'[1-2][1-2]': 'Hib',
r'[1-2][3-4]': 'risk',
r'[1-2]5': 'can’t loose customer',
r'3[1-2]': 'about to sleep customer',
r'33': 'attention needed',
r'[3-4][4-5]': 'loyal customer',
r'41': 'promising customer',
r'51': 'new customer',
r'[4-5][2-3]': 'potential loyalist',
r'5[4-5]': 'champion customer'}
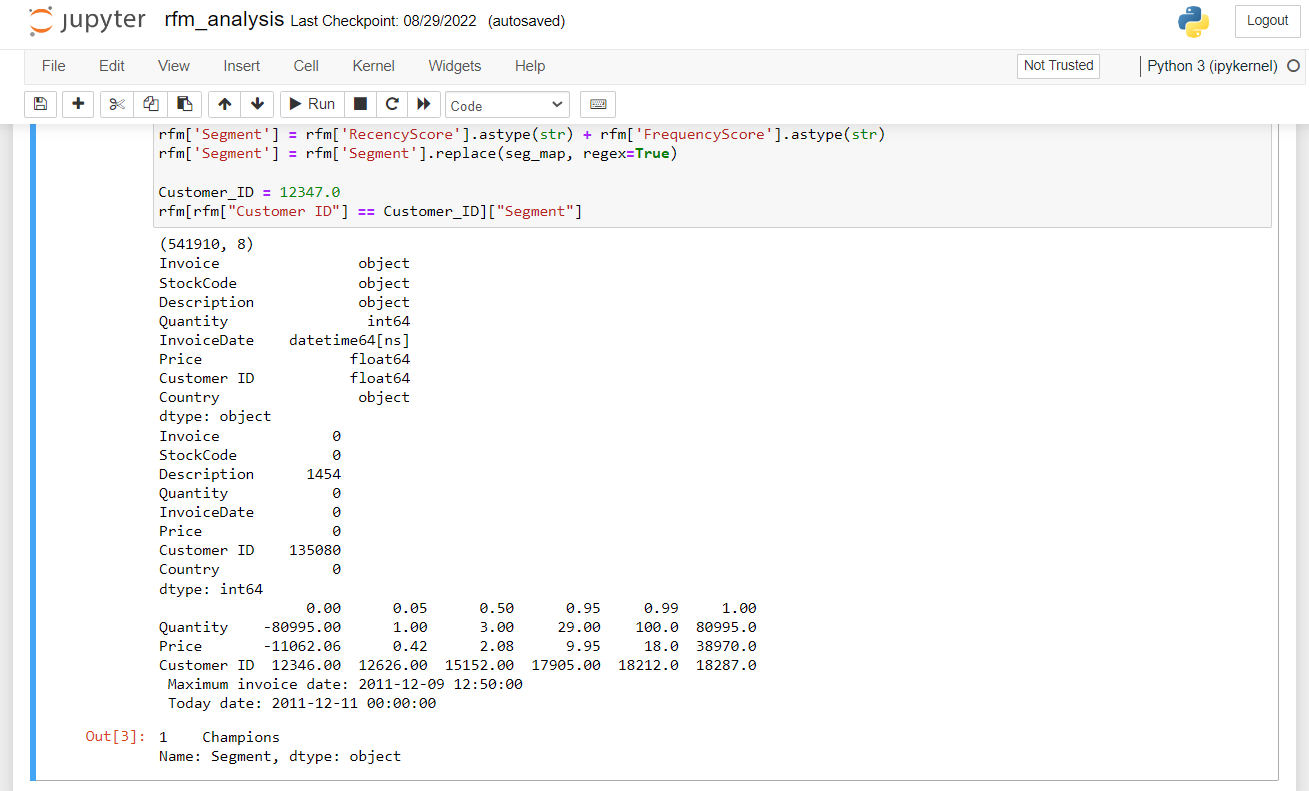
rfm['Segment'] = rfm['RecencyScore'].astype(str) + rfm['FrequencyScore'].astype(str) #changing the datatype of frequency score to string type
rfm['Segment'] = rfm['Segment'].replace(segment, regex=True) #replacing the segment column with out regex
Customer_ID = 12347.0 #assigning customer id
rfm[rfm["Customer ID"] == Customer_ID]["Segment"] #here we are finding Customer Segmentation with RFM Analysis
Summary
We are doing Customer Segmentation with RFM analysis in this Machine Learning project. For this project, we have used the RFM algorithm. We hope you have learned something new from this project.
What is the post segmentation process? Why do we segment customers?